I am sure there are dozens of articles like this talking about the same subject, but I decided to give my contribution in light of the experience I have done during the last 30 years in the marine cartography field, first as employee and later as entrepreneur.
When I started working for Navionics in the early 90’s as Cartography Production Manager we really were at the dawn of the Marine electronic charts, those years all the boater were dealing with the paper charts and pilot guide books.

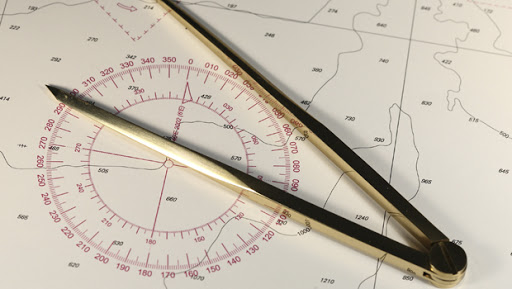
You needed a divider and a triangle, better two, to place your position, maybe coming from a Loran, on the nautical chart. And you had to deal with the different scale charts.
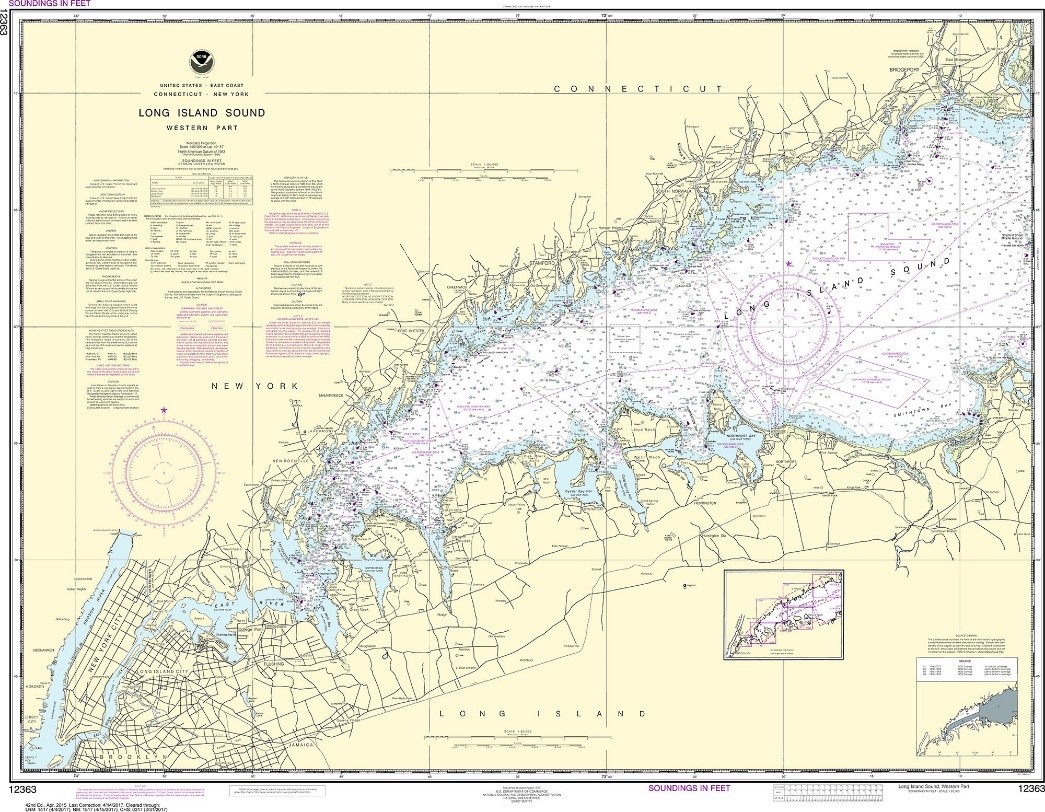
First of all, draw your position on the small scale (1:500,000), where the pen size represents around 150mt (500ft), in order to understand a general position of your boat when far from the coastline. Then repeat the same on a larger scale (1:80,000) discovering there is a certain difference between the two charts, maybe due to the manual drawing performed by the cartographer, or maybe due to the missing NTM update. Then get your binocular to find the reference buoy is half mile far from where expected…the Loran did work? Did I open the divider in the right latitude position on the chart? How many seconds is a minute? I have never been so good in tech-drawing at school.
Old fashion but….
The GPS advent moved all this stuff at a higher level of information. Initially the GPS precision was not very high, but the route was drawn.
All the Hydrographic Offices (HOs) around the world are the official responsible for the creation and maintenance of the Nautical Charts of their territorial waters. Nautical Charts, still today unfortunately, are thought and built for the Commercial and/or Military navigation, that’s why there is a lack in the large scales charts coverages. We are talking of over 20,000 Nautical charts around the world.

I would avoid talking of the early-early process using the big digitalization tables and describe the process most of the HOs used, and in some cases still are using.
Scanning, Geo-Referencing, Vectorizing and Attribution…all this today sounds old, but this was the process to generate the Electronic chart from a piece of paper. In the late 90’s all the HOs decided to produce the ENC (Electronic Nautical Charts) and created the S-57 standard, an object-oriented format with quite complex features (topology, sharing geometry, quality acceptance, etc.). All of them took their paper charts and processed the above steps.
The quality was an option…while scanning it was difficult to avoid a deformation of the resultant image. The Nautical Chart paper is quite heavy and thick, a normal scanner would make the chart slip on the rollers. Flat scanners A0 size, or vertical scanners with Teflon rollers, a bit of R&D was required.
The geo-referencing and sometimes the re-projection. Select two, four, more points on the grid. Get the latitude and longitude (ddd, mm, ss.ss), convert them into decimal degrees with at least 6 decimal digits to ensure the decimeter precision, apply the SHIFT to WGS84 correction…run.
Load the geo-referenced image and start the vectorization with manual, semi-automatic and automatic tools. In the 90’s there were not so many automatic tools for this process, and those few required more work to fix the errors than manually vectorize the chart. Draw the line, place a point, fill a polygon…then assign attributes. Do you remember the Light Characteristic? FL 2s R 5M…Flashing 2 Seconds Red 5 Nautical Miles… all this needed to be split into 4 attributes (Light Characteristic, Period, Color, Visibility) of the LIGHTS object. On the paper chart the coastline (a polyline) was representing the end of the land and the beginning of the water, just one line drawn on the paper. In the S-57 it is used to create at least 3 objects: the Land Area, the first Depth Area and the Coastline. All three must share the same geometry along the coast. This is just an example of the complexity of the process to use to generate the Electronic Charts.
But all this was just converting a paper chart coming from a survey done with a single beam echosounder (in the best case, there are still hundreds of charts using 1 century, and more, old surveys done with a rope manual check of the depth) and maybe a Loran to get the position. In the early 2000 most of the HOs were equipped with multi-beam sonars and differential GPS…and started working on satellite imagery…today we have airplane lidars, side-scan imagery, satellite lidars…but still most of the electronic charts on the market are coming from the paper conversion.

The Electronic Nautical Charts is still available in two formats: raster and vector. Even if some HOs start thinking about removing the raster version (as well as the paper) and leave only the vector product and production/maintenance process.
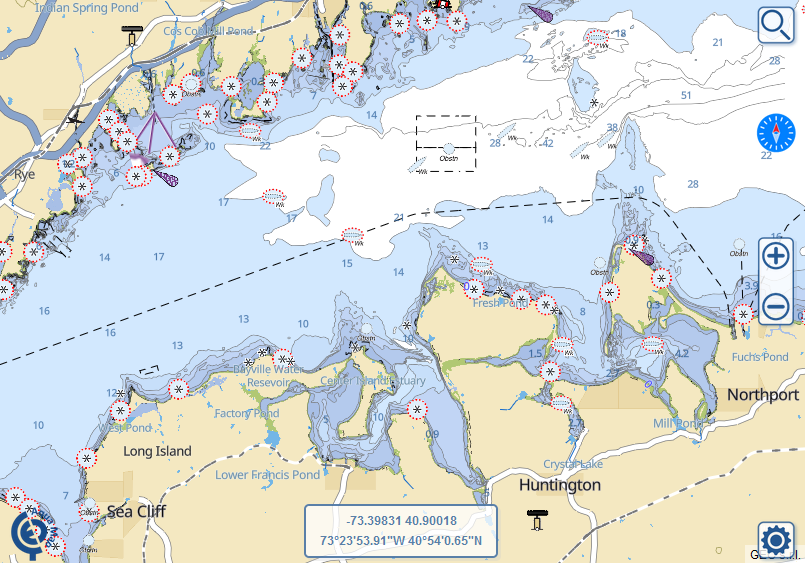
Raster is a mosaic of geo-referenced images displayed on a navigation screen with no chart interaction possibility.
Vector is an integration of geometric objects (points, lines, and polygons) each one storing several attributes. This format permits many interactions between the user/application and the chart. The software behind this interaction could help the user, theoretically, to modify any single bit of information present into the data as at his choice, just few of them: change color of an object, change shape of a symbol, resize any object and text on the screen, ask to wave an alarm when closed to an object, change unit of measure (feet > meter > feet).
In the last 30 years we had a big jump ahead in this environment and we can say today “almost” bye-bye to the paper charts. All the paper charts are now available in electronic form and all the HOs are now habited to work on an electronic-chart workflow from the survey to the final product. This took over 20 years, that is a big time in this era.
We hope the future will include soon the IoT (Internet of Things) solutions: LIDAR sensors placed along the major waterways (e.g. AICW) to discover in real time the shoaling while sailing, bridge sensor to get in real-time the Bridge Clearance…no more tides table to calculate more or less If I can pass thru that bridge…and the communities to be able to share in real-time information about their current navigation (wind, current, depth,…) as well as highlight in real-time any potential problem (stump, debris, sunk,…).
Giorgio Ghiggini, Aqua Map team.


